
Why Your Engagement Rate Is Your Best Content Playbook
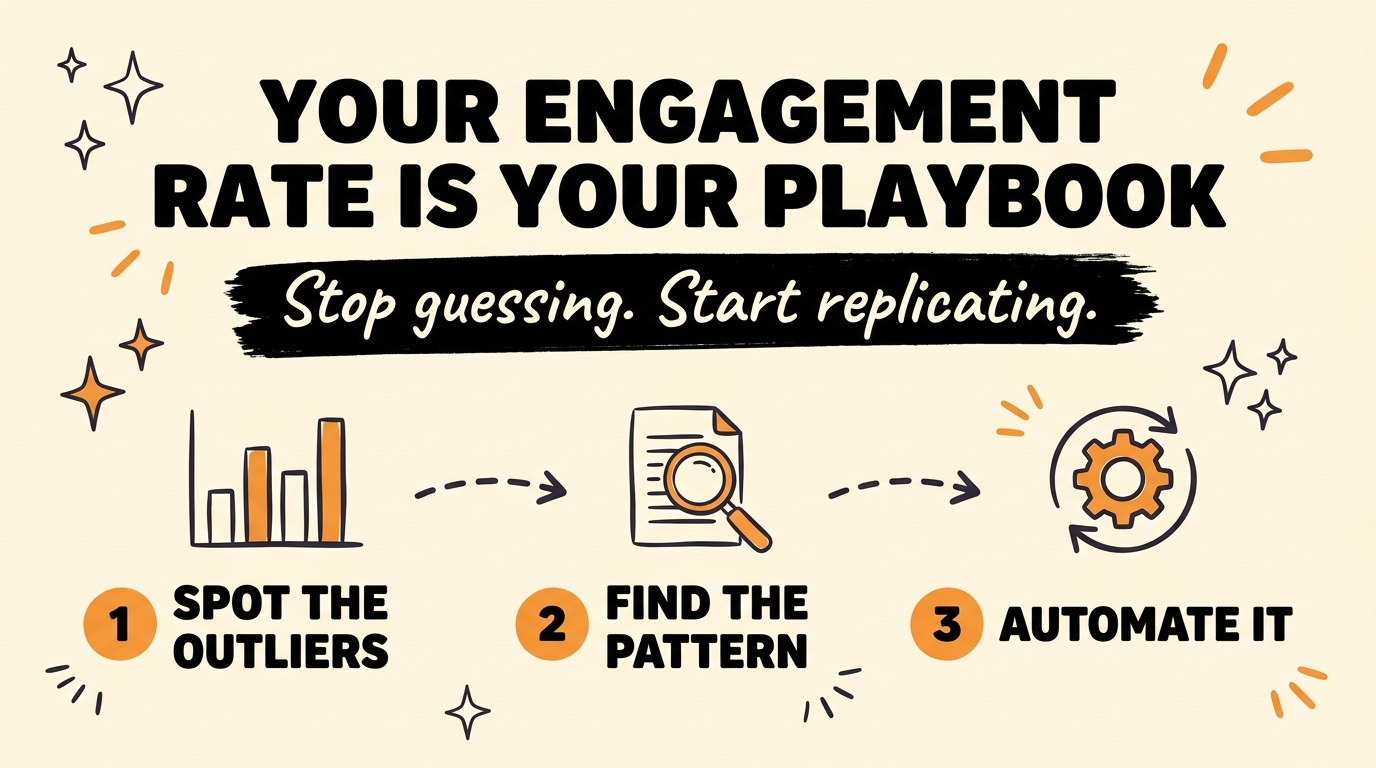
Your engagement rate is the number in your analytics that tells you exactly what to post next. Pull up two posts from the same account and you’ll often see one sitting at 7% and another at 21%. That gap is not random. It’s your audience telling you which format, topic, and style they actually want more of.
Get the Free Guide
Get the step-by-step system for turning your engagement rate data into a repeatable content playbook with Claude Code.
Get the free Engagement Rate Playbook →
Most creators post every day and check one number: reach. Reach tells you how many people saw the post. It doesn’t tell you if the post actually landed. Engagement rate does, and it’s sitting in the same analytics tab most people scroll straight past.
What Is Engagement Rate and Why Does It Beat Reach?
Engagement rate measures how many people who saw a post actually did something with it, as a percentage of that reach. A post can rack up a huge number of views and still have a low engagement rate, which means it reached a lot of people who didn’t care. A post with a smaller reach but a high engagement rate reached the right people.
That’s the number worth watching, because it’s a proxy for relevance, not just distribution. Two posts on the same account, same audience, same posting schedule, can land at 7% and 21% engagement rate. Same account. Same followers. Wildly different result. The difference lives in what the post actually was, not who saw it.
How Do You Find the Outlier Posts in Your Own Data?
The first step is pulling your last 20 to 30 posts and lining up their engagement rates side by side. Most will cluster somewhere in the middle. A few will sit well above the rest. Those outliers, the posts clearing 15% or higher, are the ones worth studying line by line.
| Post | Format | Engagement Rate |
|---|---|---|
| A | Talking-head tip | 8% |
| B | Text-on-screen list | 12% |
| C | Behind-the-scenes clip | 21% |
| D | Talking-head tip | 7% |
In an example like this, Post C is not a fluke you celebrate and move past. It’s a data point telling you that format, topic, or delivery style is doing something the others aren’t.
What Should You Do Once You Spot the Pattern?
Once you’ve flagged the outliers, look at what they share. Is it the format (behind-the-scenes vs. talking head)? The topic (a specific pain point vs. a general tip)? The hook style (a question vs. a bold claim)? Usually it’s a combination of two or three of these, and it repeats across your top posts more than you’d expect.
This is the part most creators skip. They notice a post did well, feel good about it, and go back to posting on instinct the next day. The pattern only becomes useful once you name it and repeat it on purpose.
How Do You Turn the Pattern Into an AI Content System?
This is where feeding the pattern into an AI content system changes the pace of the whole thing. Instead of manually re-reading your top posts every time you sit down to plan, you hand the pattern to Claude Code as a standing instruction: here’s what a 15%+ post looks like on this account, here’s the format and topic pattern, now draft the next five ideas against that same shape.
The pipeline stops guessing and starts replicating what already works. You batch the winners, automate the output, and the content plan runs on data instead of vibes. For a full breakdown of what an AI content system looks like end to end, the free Claude AI systems guide walks through five you can build in a weekend.
If you want the deeper reason certain posts spike while others flatline, the outlier score breakdown covers the scoring side of this same idea. And once you have a system pulling repeatable formats out of one video, the repurpose one video into three assets post shows how to stretch each winning post further without extra filming.
The full step-by-step, including the exact prompts to feed your engagement data into Claude Code, is in the free guide.
FAQ
What counts as a good engagement rate?
It depends on the platform and account size, but as a rough anchor, anything clearing 15% on Instagram Reels or TikTok is worth treating as an outlier worth studying, not just celebrating.
Is engagement rate the same as reach?
No. Reach counts how many people saw a post. Engagement rate measures how many of those viewers acted on it (likes, comments, shares, saves), as a percentage of reach. A post can have high reach and low engagement rate at the same time.
How many posts do I need before a pattern is reliable?
Twenty to thirty recent posts is usually enough to see which ones are genuine outliers versus normal variance. Fewer than ten and you’re mostly looking at noise.
Can I automate this with Claude Code even if I’m not a developer?
Yes. Claude Code reads plain instructions, so you don’t need to write code yourself. You describe the pattern in your top posts and ask it to draft new ideas against that pattern, or build a small skill that does it automatically each time you export new analytics.
What if none of my posts are hitting 15% engagement rate yet?
Then your outliers are whatever is highest relative to your own average, even if that’s 9% instead of 15%. The goal is relative comparison against your own account, not a universal benchmark.
Chasing daily posting without checking engagement rate is how creators end up busy and stuck at the same numbers. The fix isn’t posting more. It’s reading the signal that’s already sitting in your analytics and building a system that repeats what works. Join the Vibe Coding Build → if you want help setting up the AI systems that do this for you automatically.